Pompa sekrup ketebalan dinding yang sama
Cat:Pompa sekrup tunggal
Pompa sekrup yang dilengkapi dengan stator ketebalan dinding yang sama, jenis spesifikasi pompa yang sama aliran pompa, dan tekanan meningkat. Kete...
Lihat detailnya
A pump quotation usually arrives with a single curve sheet attached, and the covering email says: "The duty point sits right on the curve." Before the purchase order is signed, someone on your side has to confirm that claim. Knowing how to read a pump performance curve is the difference between a machine that runs quietly for a decade and one that cavitates, overheats, or burns out a motor inside the first month of operation.
Here is the short answer first. A pump performance curve is a two-dimensional map of one pump model running at one fixed speed on one specific liquid. It tells you how much head the pump produces at each flow rate, how much shaft power it absorbs, what efficiency it reaches, and how much suction energy it needs before cavitation begins. Reading it correctly means checking four things at the same time, namely head against flow, power against flow, efficiency against flow, and NPSHr against flow, and then comparing all four against the system the pump will actually serve.
The second half of the answer matters just as much. A curve on its own never confirms a selection, because the pump never operates alone. It operates against pipe friction, static lift, valves, bends, viscosity and temperature, and those elements form their own curve. Only where the two curves cross does real performance exist.
The horizontal axis of a conventional curve is flow rate, expressed as cubic metres per hour, litres per minute, litres per second or gallons per minute. The vertical axis is head, expressed as metres of liquid column, bar, or pounds per square inch. The unit choice is not cosmetic. One bar of pressure corresponds to roughly 10.2 metres of water column, but to only about 8.1 metres of a light solvent with a specific gravity of 0.8. A buyer who reads "10 bar" on a datasheet and expects "10 metres" of performance will end up with a pump that either overshoots or falls short.
Every curve is drawn against a fixed set of conditions. Those conditions include rotational speed, rotor and stator geometry, liquid viscosity, liquid temperature, specific gravity, and solids content. Change any one of them and the curve moves. This is the single most common source of disappointment in industrial pump procurement, because a curve measured on water at 20 degrees Celsius is routinely presented as evidence for a duty that involves sludge at 60 degrees Celsius with eight percent suspended solids.
It is also worth knowing that curves are generated from bench testing, not from a theoretical calculation, and that test standards allow a tolerance. Under widely used acceptance classes, a manufacturer may declare a head that sits a few percent above or below the measured value. That tolerance is normal and legitimate. What is not legitimate is a curve sheet with no stated standard, no stated viscosity, and no stated speed. Ask for those three pieces of context before you compare anything.
Curves also come in families. A centrifugal pump datasheet often carries a set of curves for different impeller trims, plus a set of speed lines. A progressive cavity pump datasheet is usually simpler, often a single flow-against-pressure line for one speed, sometimes with two or three additional speed lines and a power line. Fewer lines is not a sign of a weaker product. It reflects a fundamentally different hydraulic principle, which is explained later in this article.
Most pump curve sheets carry four or five separate traces on the same grid. Reading them individually is easy. Reading them together is where real selection skill lives, because a pump that looks comfortable on the head curve can be badly out of place on the power curve or the NPSHr curve at the very same flow rate.
| Curve | Axes | Question it answers | Common misreading |
|---|---|---|---|
| Head against flow | Flow on the horizontal axis, head on the vertical axis | How much lift or pressure the pump delivers at a given flow | Treating head as the pressure the pump generates, while ignoring inlet pressure and static lift |
| Efficiency against flow | Flow on the horizontal axis, percentage on the vertical axis | Which flow band gives the most useful work per kilowatt consumed | Reading a single number from the datasheet instead of reading the value at the actual duty flow |
| Shaft power against flow | Flow on the horizontal axis, kilowatts on the vertical axis | How large the driver and the coupling need to be | Sizing the motor from the rated point only, then running the pump at higher flow |
| NPSHr against flow | Flow on the horizontal axis, metres on the vertical axis | How much suction energy the pump needs to avoid cavitation | Treating NPSHr as a constant rather than a value that rises with flow |
| Speed or trim lines | Parallel or nested curves on the same grid | How the whole performance envelope shifts with speed or geometry | Assuming a lower speed simply scales flow down while leaving everything else unchanged |
Three of these deserve extra attention during procurement. The power curve is the one that determines whether the electric motor is adequate, and it is frequently the reason a pump trips a breaker at high flow. The NPSHr curve is the one that determines whether the pump destroys itself from the inside. The efficiency curve is the one that determines the electricity bill and the wear rate, which is why it should be evaluated across the expected operating band and not merely at the design point.
If the pumping duty involves a viscous liquid, a further correction layer applies. Viscosity reduces the flow a pump can deliver at a given head, lowers efficiency, and increases the power required. Some manufacturers publish correction factors, others publish a separate curve family for higher viscosity. Neither approach is a substitute for testing, especially in a progressive cavity pump where the liquid itself lubricates the rotor and stator interface.
The procedure below works for centrifugal pumps and for positive displacement pumps alike, though the emphasis shifts depending on the family. Follow the sequence rather than jumping to the head curve first, because skipping the context steps is what produces expensive mistakes.
Step five is the one that most often changes the answer. A buyer specifies twelve cubic metres per hour, the supplier selects a pump whose curve crosses that value at exactly the required pressure, and everybody is satisfied. Six months later the valves are throttled, the pipes have scaled, and the system curve has steepened. The duty point has slid to the left, flow has dropped, and recirculation is heating the casing. A curve read in isolation would never have revealed this.
Most published guidance on reading pump curves was written for centrifugal machines, and it translates imperfectly to progressive cavity pumps. The difference is worth understanding before you apply a centrifugal reading method to a positive displacement datasheet.
A centrifugal pump converts velocity into pressure, so its head falls steadily as flow rises. A progressive cavity pump moves a fixed volume per revolution through a sealed cavity between the rotor and the stator, so at constant speed the flow is almost independent of pressure. On a pressure-against-flow chart, that produces a nearly vertical line rather than a gently sloping one. At constant speed, the pump delivers roughly the same volume whether the discharge pressure is two bar or twelve bar, with a small amount of internal slip causing the line to lean slightly.
Three practical consequences follow. First, flow control in a progressive cavity pump is normally achieved by changing speed, not by throttling a valve. Second, the working pressure is determined primarily by the number of stages and the rigidity of the stator geometry, not by the shape of a falling head curve. Third, the risk profile is inverted. Where a centrifugal pump destroys itself by running at too low a flow, a progressive cavity pump is far more likely to be damaged by running at excessive pressure, which generates heat at the rotor and stator interface and degrades the elastomer.
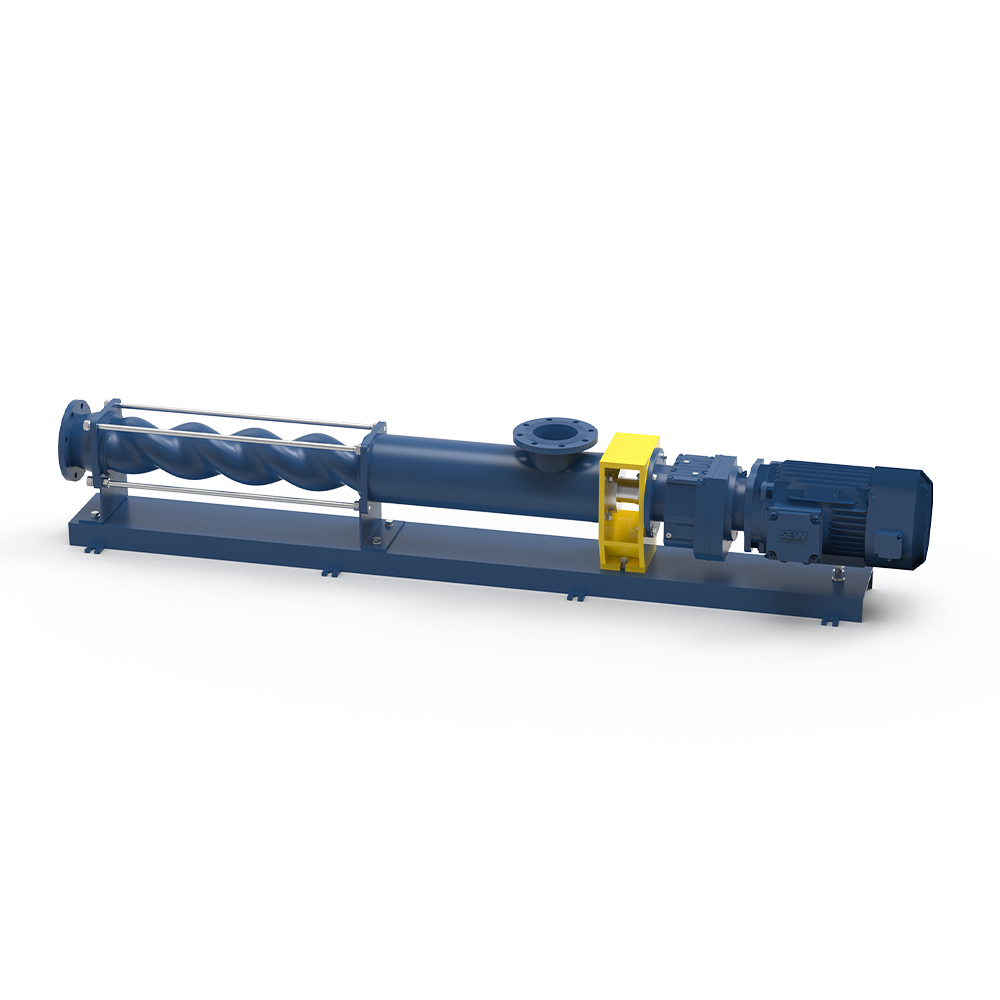 Equal Wall Thickness Screw PumpsThis screw pump has good self-priming ability, with water as the medium, suction on up to 3-5 meters; Conveying solid particles liquid: can convey liquid containing so...View Product →
Stator construction therefore has a direct effect on how flat the curve stays in service. An equal-wall-thickness stator distributes the rubber more evenly around the cavity, which improves heat dissipation and keeps the compression fit more stable over long runs. In curve terms, that means the delivered flow stays closer to the theoretical value for longer, and the small downward slope caused by slip develops more slowly.
When a supplier presents a progressive cavity curve, ask for the pressure axis in bar rather than metres of head, ask for the corresponding power line, and ask what stator material the curve was generated with. Nitrile, EPDM, and hydrogenated nitrile behave differently under the same pressure, and a curve issued for one compound is not automatically valid for another.
The system curve describes what your piping network demands. It has two components. The static component is the fixed lift between the suction surface and the discharge point, and it does not change with flow. The dynamic component is friction loss through pipes, fittings, valves, heat exchangers and bends, and it rises approximately with the square of the flow rate. Doubling the flow roughly quadruples the friction loss.
Plot the sum of those two components on the same axes as the pump curve and you obtain a rising line. Where it crosses the pump head curve, you have the duty point. That crossing is the only point at which the pump and the system agree, and it is the flow that will actually be delivered.
Several routine field changes move that crossing point, and each one has a characteristic signature:
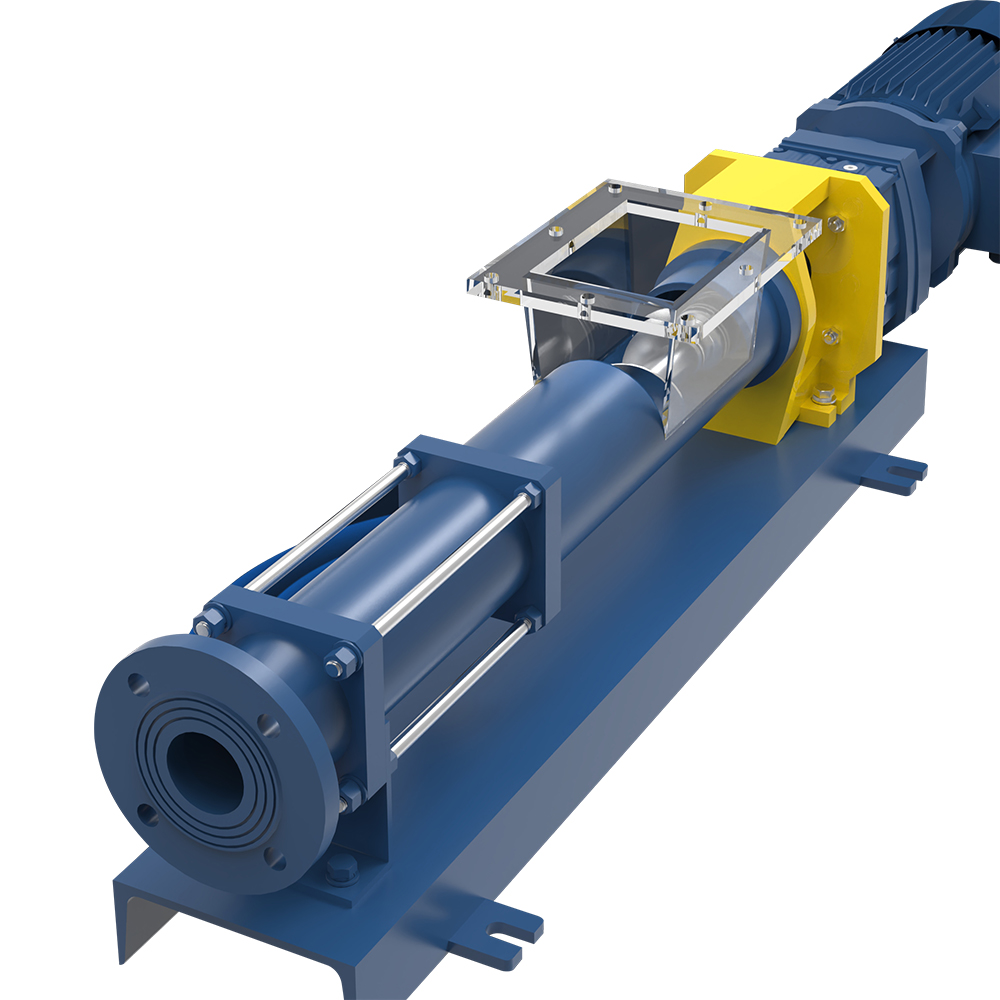 H-type progressive cavity pumpsThe H-type progressive cavity pump adopts precise manufacturing technology and advanced structural design to ensure that it can maintain extremely high stability durin...View Product →
Once you know how far the duty point can migrate, you can decide whether a fixed-speed pump is adequate or whether variable speed control is justified. Variable speed is not merely an energy measure. It is a way of keeping the duty point inside a healthy band when the system curve is unstable, and it is often the cheapest way to protect a stator from repeated over-pressure events.
Efficiency is the number most often ignored during pump selection and the number most often blamed after commissioning. On almost every pump curve the efficiency line rises, peaks, and then falls away as flow continues to increase. The peak is the best efficiency point, and every pump is happiest working inside a band around it.
A progressive cavity pump transfers fluid by a rotating rotor inside a stationary stator, and a substantial share of the losses comes from friction between those two surfaces. That friction rises with speed and with pressure differential, which is why efficiency in a progressive cavity pump is generally lower than in a clean-water centrifugal pump of comparable size, and why the shape of the efficient band matters more than the absolute number printed on the sheet.
Schematic efficiency band of a fixed-speed single screw pump
Illustrative values only. Actual figures depend on model, speed, stator compound and liquid.
The chart above is a schematic illustration rather than a guarantee for any individual model, but the shape it shows is typical of a fixed-speed single screw pump. At fifty percent of rated flow, the pump is doing very little useful work, and only about thirty-eight percent of the shaft energy turns into hydraulic energy. Most of the remainder is lost as heat inside the stator, which is also the mechanism that shortens stator life. As flow rises toward the rated point, the geometry of the rotor and stator starts to work in the pump's favour, and efficiency climbs steeply. The peak in this example sits close to the rated flow, at roughly sixty-eight percent.
Operating to the right of the peak is safer than operating to the left, but it still carries the cost of over-sizing. At one hundred and twenty-five percent of rated flow, efficiency in the illustration has fallen back to about fifty-two percent, and the extra kilowatts are being converted into heat and noise rather than useful delivery. The practical lesson is that a pump whose duty point sits well outside a reasonably narrow flow band will wear in a region it was never designed for. In a progressive cavity pump, running away from the best efficiency point also accelerates stator rubber wear, because internal slip increases and the contact pressure between rotor and stator rises accordingly.
Look at the direction of the power curve as well. Shaft power generally increases with flow, which means the electric motor must be selected from the highest flow the pump will ever see, not from the nominal duty point. That is why a curve sheet always shows both the efficiency line and the power line. Reading only one of them allows a user to pair an undersized motor with an otherwise suitable pump. It also explains why efficiency should never be quoted as a single figure. Efficiency is a ratio that depends on viscosity, speed and pressure differential, and each time those conditions change, the whole band shifts.
Net positive suction head is the part of curve reading that protects the pump from internal destruction. NPSHr is the suction energy the pump itself requires, and it rises as flow increases. NPSHa is the suction energy your installation actually provides, and it falls as flow increases because friction losses in the suction line grow. Cavitation occurs when the two lines cross.
The available value depends on absolute pressure at the liquid surface, the height of the liquid above or below the pump inlet, the friction loss in the suction line, and the vapour pressure of the liquid at the pumping temperature. Vapour pressure is the term that catches people out, because it climbs steeply with temperature. A liquid that gives a comfortable margin at twenty degrees Celsius may cavitate freely at seventy degrees Celsius in the same installation.
A margin is required because curves are not exact and processes drift. A common working rule is to keep NPSHa at least half a metre to one metre above NPSHr at the duty flow, with a larger margin for hot liquids, high-energy duties, or liquids carrying dissolved gas. Where the pump handles sludge, pulp, or high-viscosity media, the margin should be wider still, because the suction behaviour of a non-Newtonian fluid is difficult to predict from a water-based curve.
Several warning signs indicate that the suction side is being over-drawn. These include a rattling or gravel-like noise from the pump, vibration that appears only at certain flows, a head reading that falls below the curve, and stator damage concentrated on the suction end. Any of these should prompt a check of NPSHa against the NPSHr curve rather than an adjustment of the discharge valve.
Most curve-related failures trace back to a small number of repeated errors. Checking for them before the order is placed takes fifteen minutes and saves months.
A sixth, quieter mistake is worth adding. Buyers frequently compare curves from different suppliers without checking that both were generated at the same speed and the same acceptance standard. A curve measured at a lower speed can look gentler and more conservative while delivering less than a competitor's higher-speed unit. Normalise the conditions before you compare.
Theoretical curve reading becomes concrete when it is tied to a sector. In each of the industries below, one particular aspect of the curve tends to dominate the selection decision.
Environmental water treatment. Sludge and wastewater duties involve variable solids content and frequent flow changes. The efficiency band and the power curve matter most here, because the pump often runs for thousands of hours a year and electricity dominates lifetime cost. A wide efficient band tolerates the fluctuations that a narrow one cannot.
Chemical processing. Media range from thin solvents to viscous resins, and vapor pressure often becomes the limiting factor. NPSH margin and stator compound selection drive the design, and the curve must be corrected for specific gravity before any power calculation is trusted.
Paper and pulp. Stock consistency changes along the process, so the system curve is genuinely unstable. Selecting on a single duty point is risky. Look instead at the full operating envelope and consider speed control.
Food and pharmaceutical production. Gentle handling and cleanability usually outweigh pure hydraulic efficiency. Curves are read with wider tolerances and lower shear limits, and pump speed is often deliberately kept low to protect the product.
Petrochemical and energy. High pressures and high temperatures compress the available NPSH margin, and multi-stage geometries become common. Verify the curve at the actual pumping temperature rather than at ambient conditions.
In every one of these sectors, the useful habit is the same. Start from the process conditions, build the system curve, then read the pump curve at the intersection. Working in the opposite direction, from a preferred pump model toward a justification, is how unsuitable equipment ends up in service.
A curve describes a pump in good condition. In service, performance drifts, and the drift is usually visible on the curve before it becomes visible in production figures. The two components that drive that drift are the stator and the rotor.
The stator is an elastomer component, and elastomer ages. It hardens, swells, or wears, and as the compression fit between rotor and stator relaxes, internal slip increases. On a pressure-against-flow chart, that appears as a curve that leans further to the right, meaning less flow at the same pressure. Operators often compensate by raising the speed, which raises the temperature, which accelerates the ageing. The loop closes quickly once it starts.
The rotor wears more slowly, but abrasive solids and dry running both take a toll. A worn rotor changes the cavity geometry and reduces volumetric efficiency, and it also places additional load on the stator. Extension shafts and couplings should be inspected at the same interval, because a bent shaft will show up as a vibration signature that mimics cavitation.
 Stator for progressive cavity pumpsWe introduce advanced equipment and manufacturing processes from abroad, strictly follow the ISO quality system for production, ensure stable quality, and have our own...View Product →
A practical maintenance plan keeps replacement parts matched to the original curve. When a stator is replaced, the rotor should be measured, because pairing a new stator with a worn rotor reproduces the original problem in a different form. Many operators keep a simple log of flow, pressure and power at a fixed speed, plotted monthly against the original curve. When the measured point drifts more than a defined percentage away from the curve, it is time to inspect rather than to keep adjusting.
Start with the axes and their units, then confirm the stated speed, viscosity and specific gravity in the footnote. Draw a vertical line up from your required flow, and read the head, efficiency, power and NPSHr values at that line. If the footnote is missing any of those conditions, request a corrected sheet before proceeding.
On the overwhelming majority of published curves, flow runs along the horizontal axis and head runs along the vertical axis. Some software-generated charts reverse the convention, so always check the labels rather than assuming.
Read the shaft power at the highest flow the pump can realistically reach, not at the nominal duty point, then apply a service factor typically between 1.15 and 1.25. For viscous liquids or high specific gravity, correct the power before applying the factor.
Yes, although it is often presented differently from a centrifugal pump. Because the flow is nearly independent of pressure, the NPSHr curve is comparatively flat, but it still rises with speed and must be compared against the available suction head at the duty flow.
The usual causes are a system curve that differs from the design assumption, a liquid whose viscosity or specific gravity differs from the test liquid, internal wear in the stator or rotor, or a speed that differs from the speed stated on the sheet. Measure all four before assuming the pump is defective.
It is the flow at which the pump converts the greatest share of shaft power into hydraulic energy. Working within a band around it reduces energy consumption, vibration and wear. Working far to the left raises temperatures and recirculation; working far to the right overloads the motor.
Not necessarily. The relevant figure is efficiency at your duty point, sustained across the range of conditions you expect. A pump with a slightly lower peak efficiency but a much wider efficient band often costs less to own over a decade.
Only as a rough starting point. Viscosity reduces delivered flow, lowers efficiency and increases power demand. For heavy products, request corrected curves or a factory test with a representative liquid.
Reading a pump performance curve is ultimately a discipline of asking the right questions in the right order. What liquid, at what temperature, at what viscosity. What static lift and what friction loss. What flow range will the process actually demand across a full year of operation. Only after those answers are fixed does the curve become meaningful, and only then can a supplier be held to the performance they promised.
Explore further
For buyers sourcing progressive cavity equipment, the same logic applies to the supplier as to the curve. A manufacturer who can explain the test conditions behind a curve, correct it for your liquid, and supply matched stator and rotor components for the life of the pump is offering more than a catalogue number. That combination of documentation and spare-part continuity is what keeps a duty point stable for years rather than months.
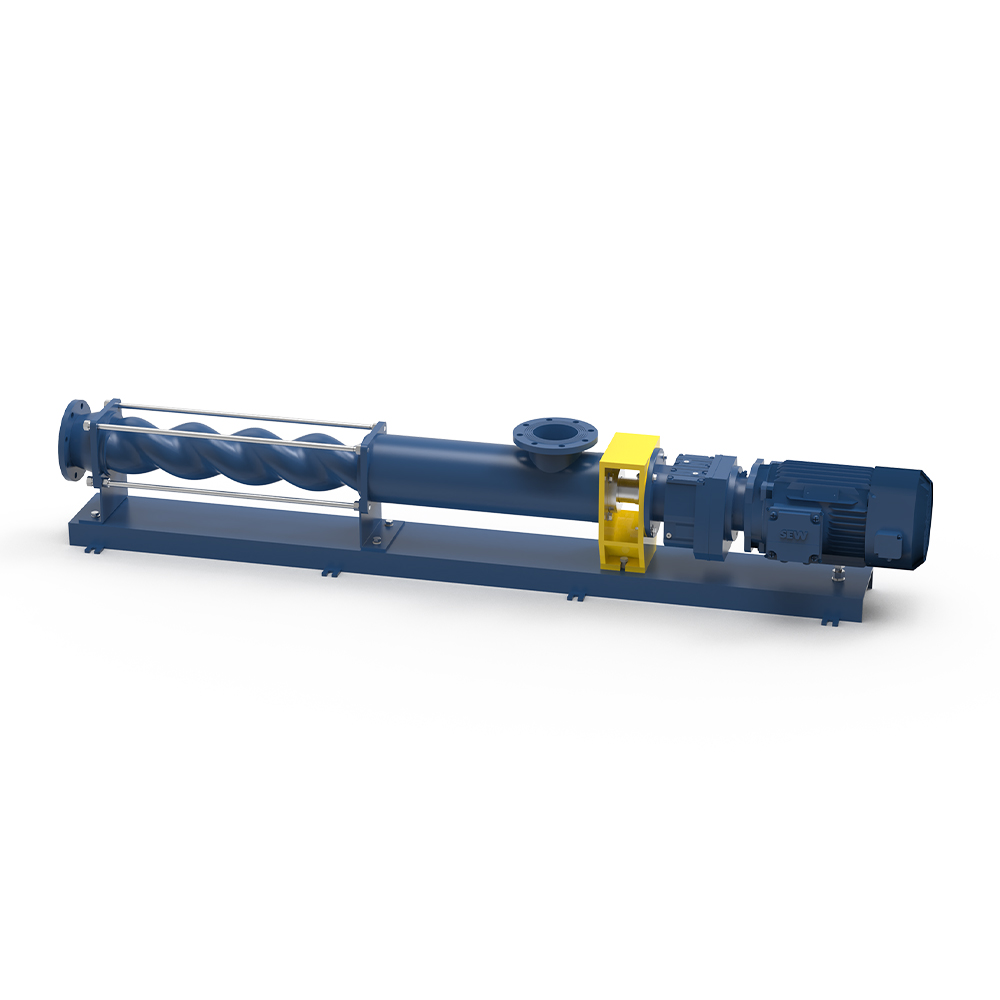
Pompa sekrup yang dilengkapi dengan stator ketebalan dinding yang sama, jenis spesifikasi pompa yang sama aliran pompa, dan tekanan meningkat. Kete...
Lihat detailnya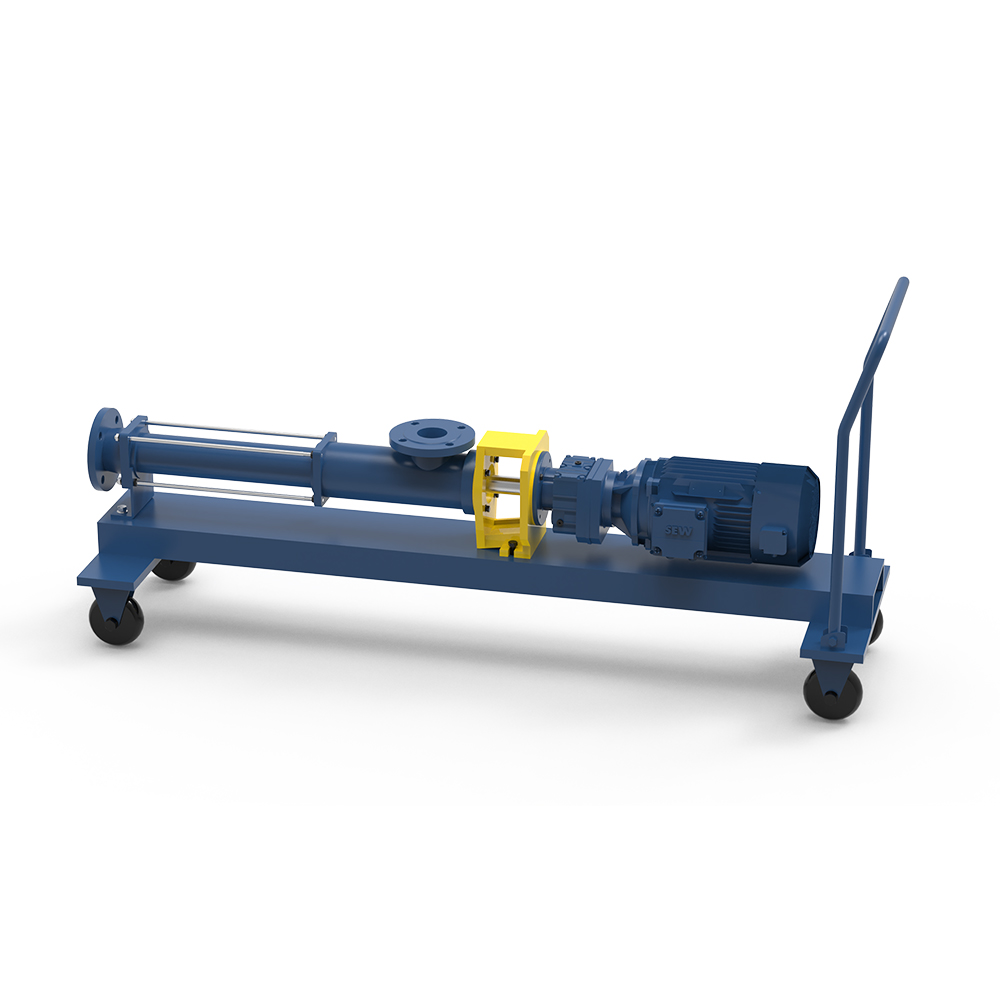
Pompa yang dipasang di kendaraan Mika, dasar pompa tidak hanya stabil dan andal, tetapi juga dilengkapi dengan roda universal, roda ini berputar se...
Lihat detailnya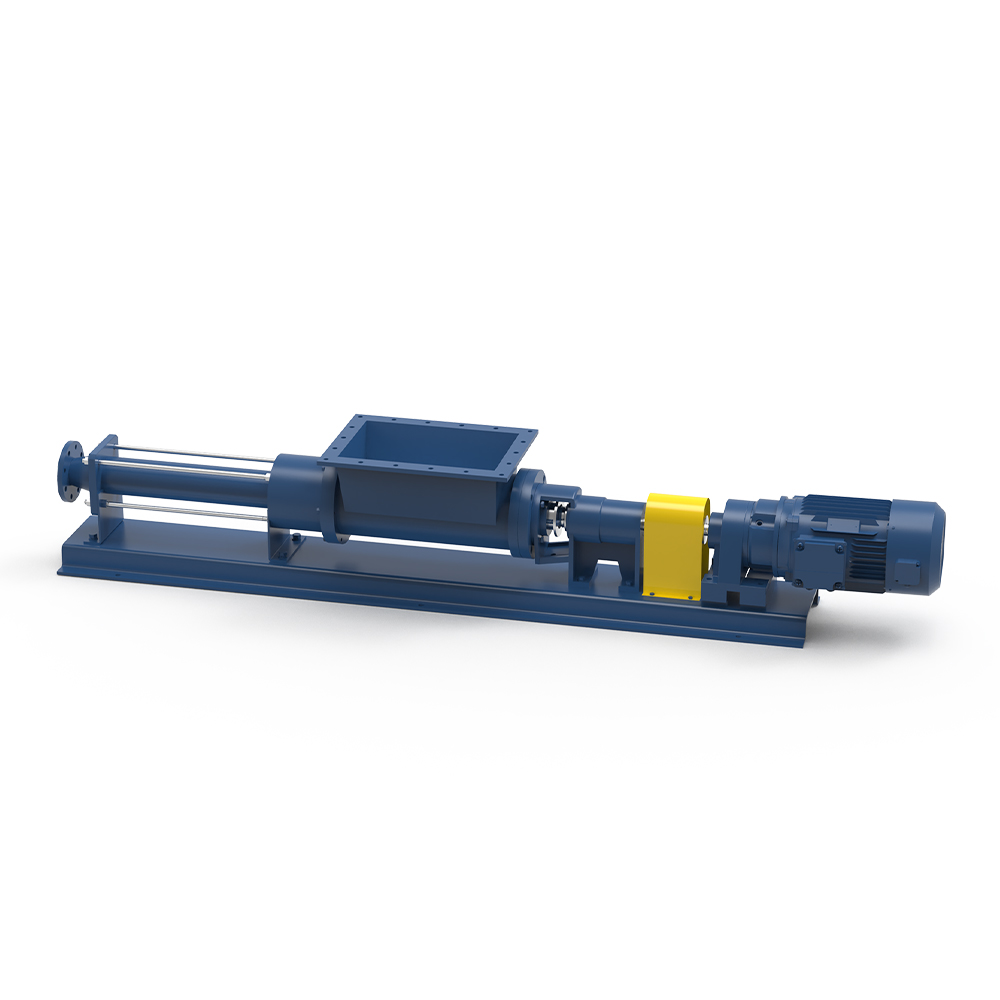
Inlet adalah pompa tipe W Hopper Design yang besar dengan poros penghubung dengan beberapa baling spiral (yang secara efektif dapat mencegah akumul...
Lihat detailnya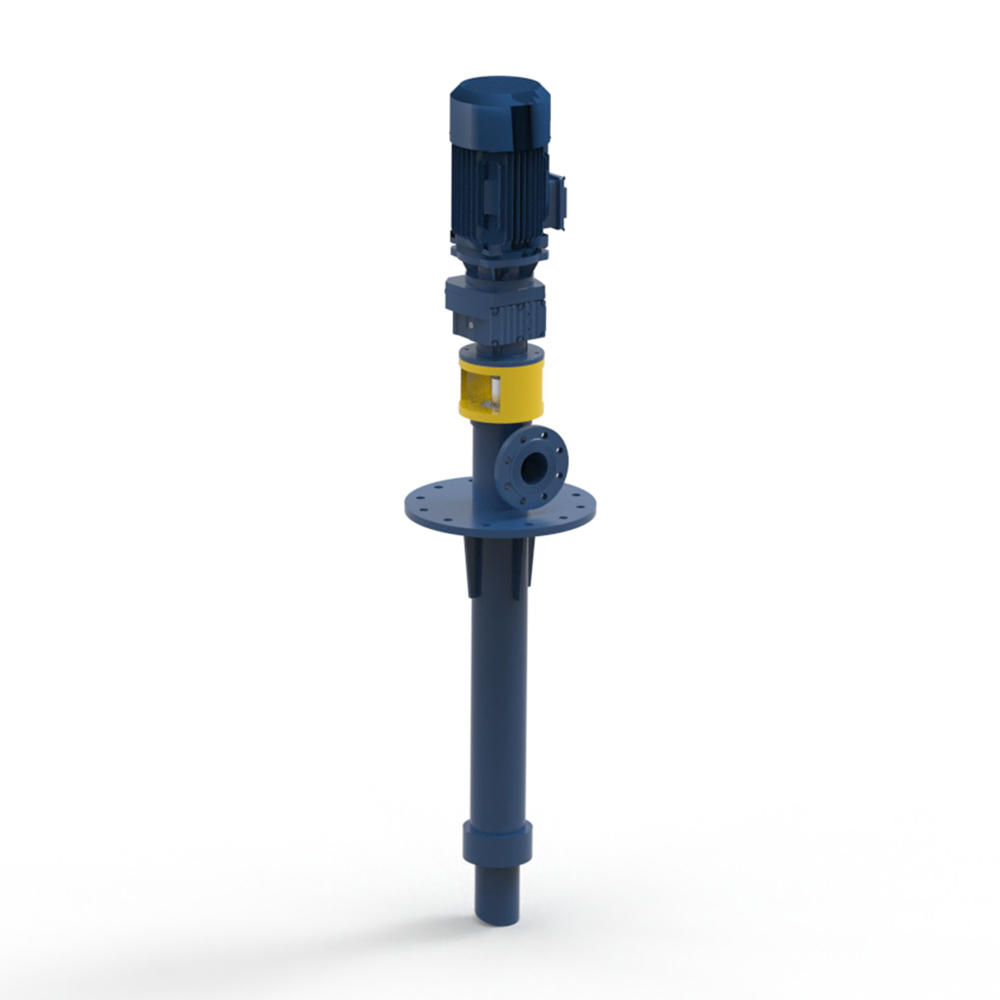
Pompa sekrup tipe-T vertikal Mika dapat dicapai melalui panjang bodi pompa ke berbagai kedalaman kolam yang berbeda, hopper pompa terletak di bagia...
Lihat detailnya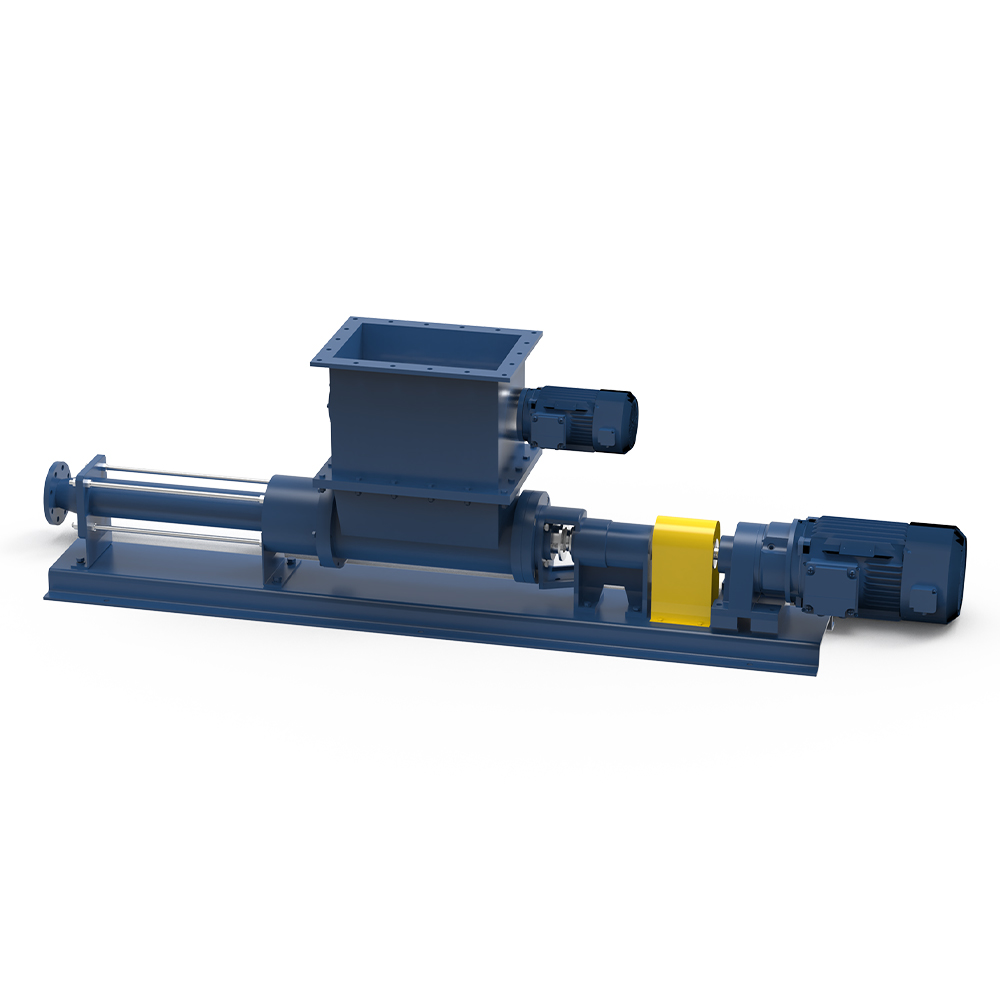
Inlet ini dirancang untuk hopper besar dengan perangkat p-pump yang memecahkan jembatan cocok untuk menyampaikan bahan dengan viskositas tinggi, ka...
Lihat detailnya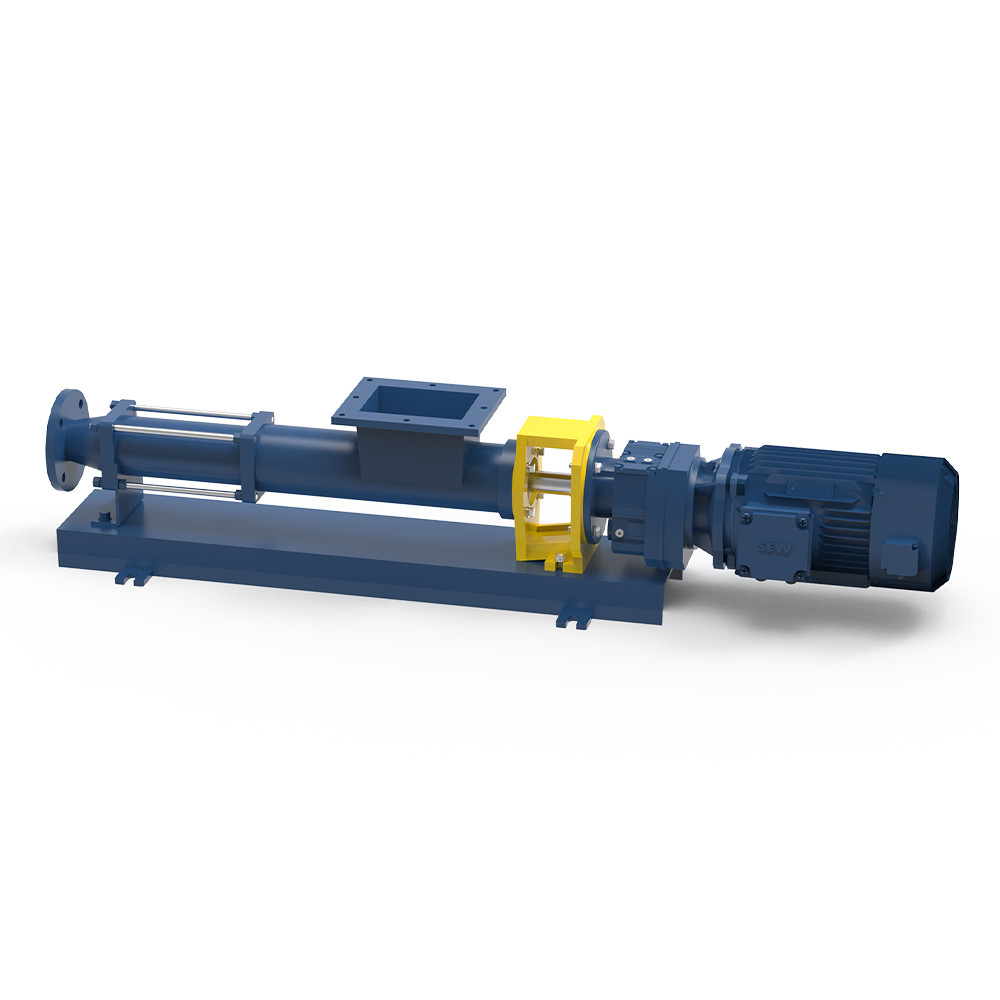
Inlet ini adalah pompa H hopper rectangular kecil, cocok untuk menyampaikan kandungan padat viskositas tinggi kurang dari 15% dari medium, seperti ...
Lihat detailnya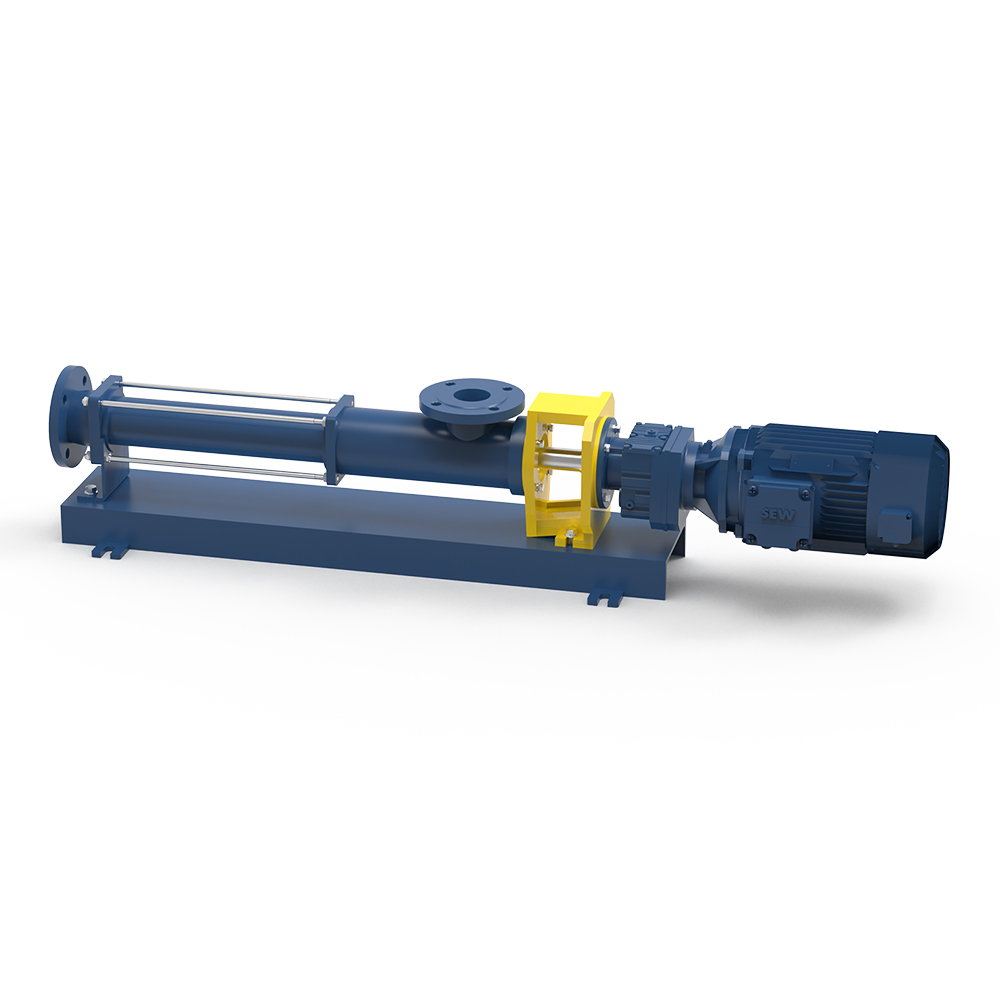
Pompa Mika Classic B Direct-Connected adalah kompak, mudah dipelihara, dengan biaya investasi yang rendah, dan cocok untuk berbagai kondisi kerja u...
Lihat detailnya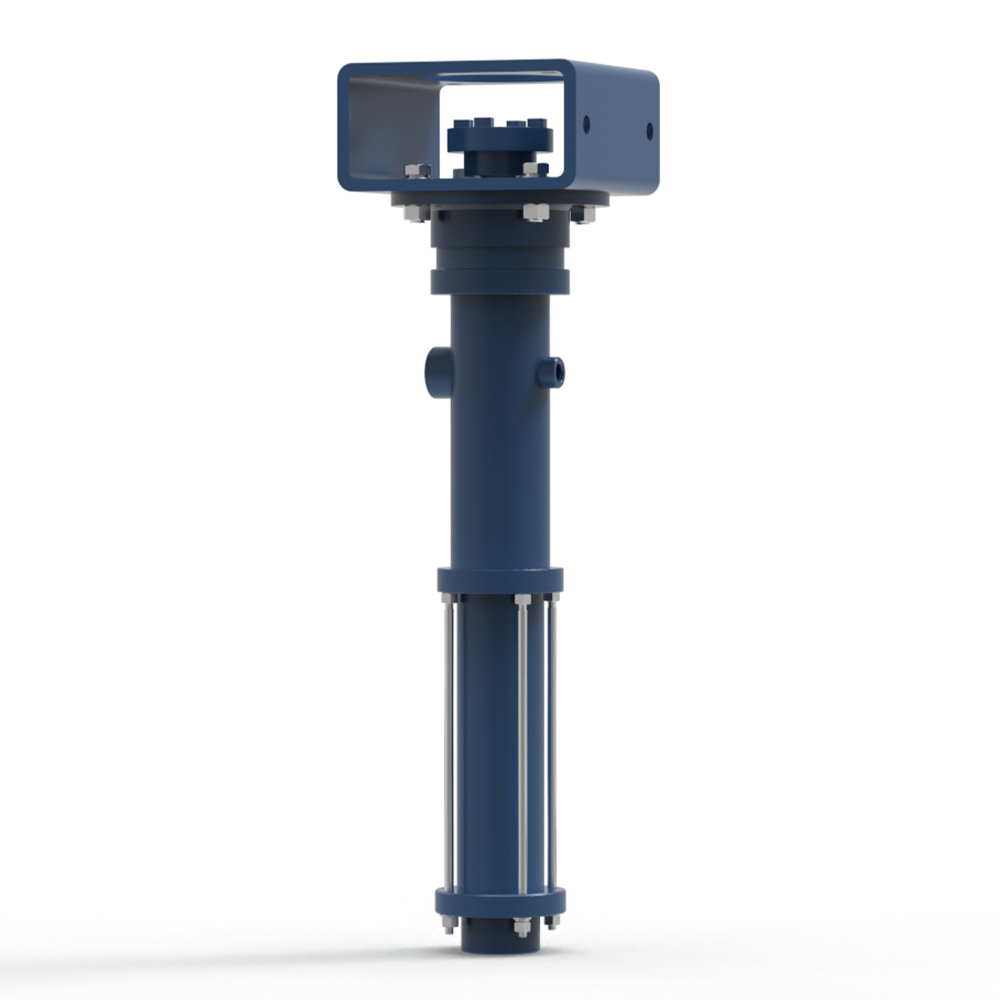
Laju aliran yang tepat dan berbagai bahan untuk pengukuran dan pengiriman semua jenis sealant. Prinsip kerja Pompa Meijia adalah pompa...
Lihat detailnya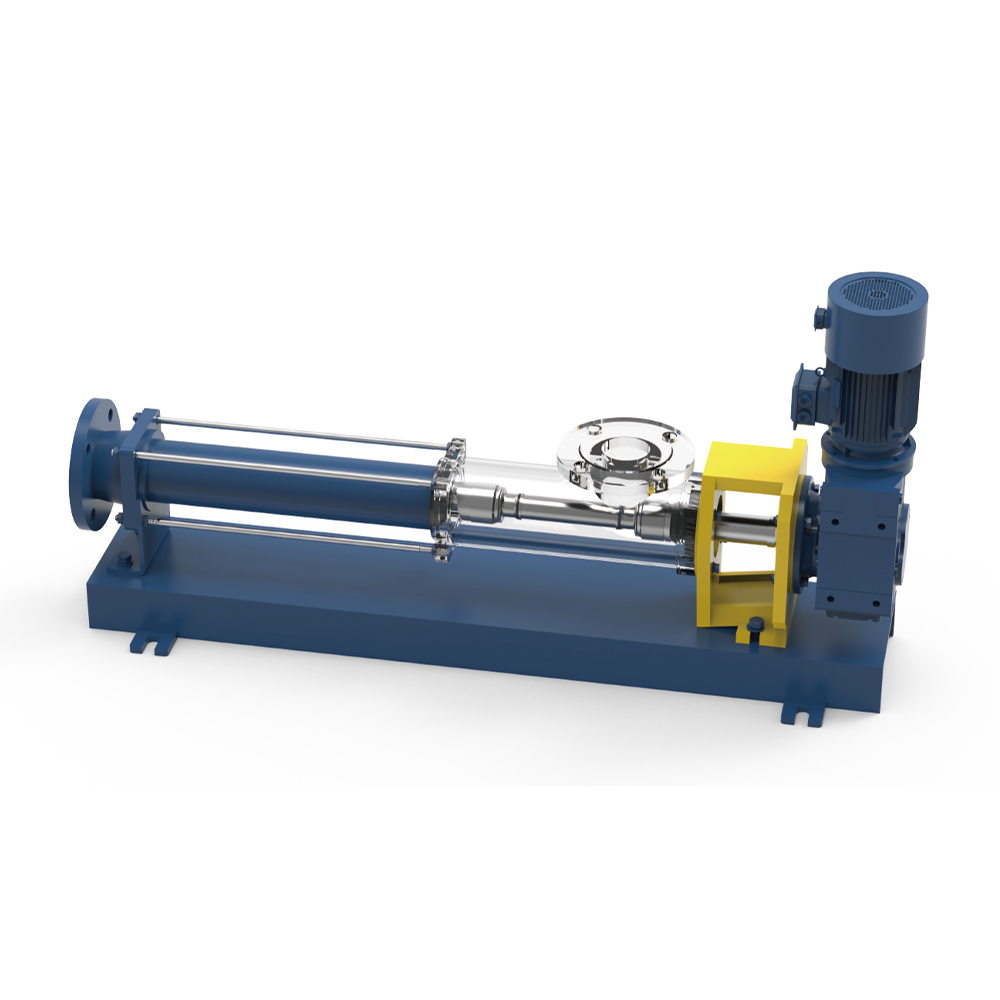
Peredam kecepatan mengadopsi pereduksi kecepatan seri K, dan panjang pompa dapat dipersingkat, sehingga dapat digunakan di tempat -tempat di mana r...
Lihat detailnya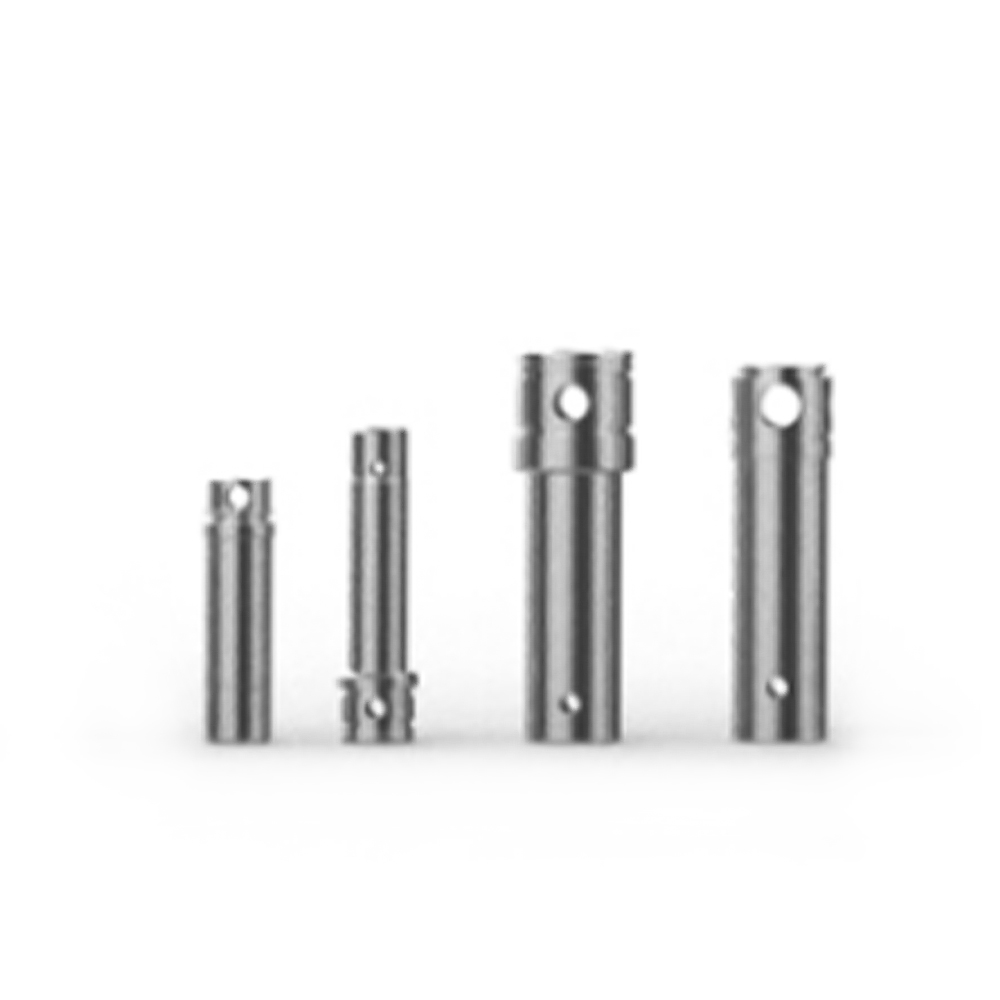
Beberapa bahan tersedia: Q235.304.316L, 2205.2507, dll .
Lihat detailnyaHubungi kami
Add: No. 36 Xintai Road, Economic Development Zone, Jingjiang City, Provinsi Jiangsu, Cina
Tel: +86-13515167342
Fax: +86-523-84261117
E-mail:
Kami akan senang
Dengarkan dari Anda!
